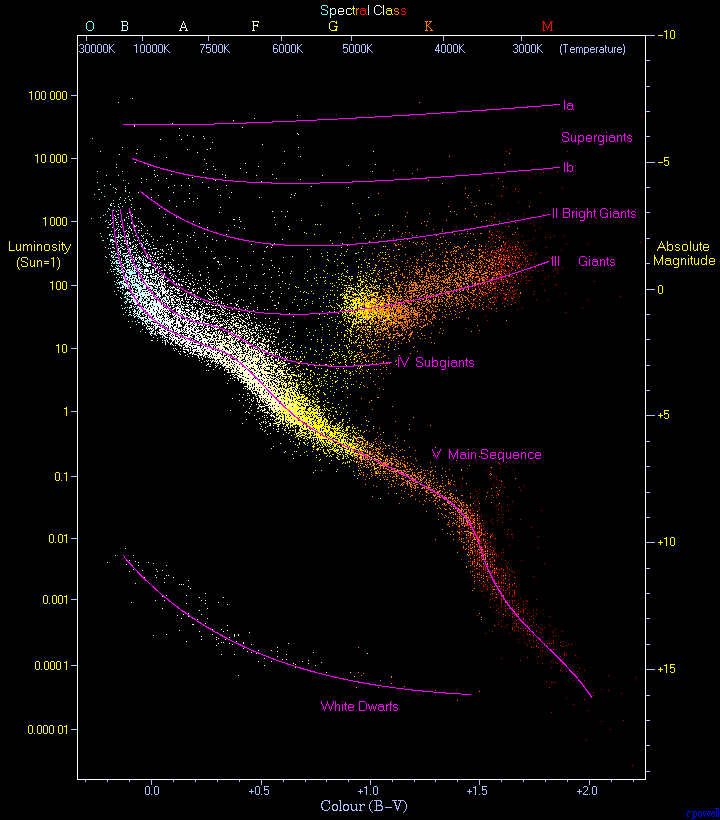
Astute readers will note that this is not the first time this diagram has made an appearance on this blog (source).
This diagram is born of scaling relationships whose derivation I will discuss separately, but the conceptual basis for the H-R diagram isn't too hard to get your head around even without seeing the mathematical justification for it. As you can see, the horizontal axis of the diagram above is surface temperature (actually log$_{10}$ surface temperature), while the vertical axis is luminosity (again, really log$_{10}$ luminosity). These two quantities are, as it turns out, related by a power law--as are mass and luminosity. When astronomers began observing stars, it turned out that they began to fall into pretty specific groups on this diagram, as evidenced by the large empty areas.
Perhaps the most important feature is the dense line running from the top left to the bottom right, which is known as the main sequence. This is where essentially all stars spend most of their lives, from the start of nuclear fusion up until they begin to die out. Stars which are born larger are brighter, bluer, and hotter (as well as shorter-lived), and as such are in the upper left of the diagram. Dimmer, redder stars are cooler (and longer-lived), and can be found in the bottom right of the diagram. However, a scale of temperatures and luminosities exists between the extremes of the Pistol Star and of Proxima Centauri. Along this scale are the spectral classes of main sequence stars: O, B, A, F, G, K, and M (as well as a few less well-defined and more recently added others). The Sun, for instance, is a rather bright G-type star.
However, stars are not on the main sequence for their entire lives. As stars begin to die, they puff up into giants (or supergiants--or hypergiants!) and do some pretty crazy stuff. In the process, they go careening off the main sequence to the right into the land of giants, where stars like Betelgeuse and Arcturus can be found. Many of the brightest stars in our sky aren't actually main sequence stars, simply because giants are so incredibly massive and luminous.
The star at the center of this cluster--located in the Large Magellanic Cloud--is R136A1, the most massive and most luminous star known (at nearly nine million times the luminosity of the Sun). R136A1 is a Wolf-Rayet star, a type of giant star which is in the process of shedding huge amounts of mass via stellar wind (source).
Once a star has evolved into a giant, it rapidly approaches the end of its life. If the star is big enough (around 10 solar masses) it will collapse in on itself and rebound in a supernova, leaving behind a black hole or neutron star. However, smaller stars--like our Sun--will simply shed their outer layers, leaving behind an incredibly dense core in the form of a white dwarf. What is left behind is a white dwarf, which ends up in the cloud at the bottom of the H-R diagram. These objects are not, strictly speaking, stars, in the sense that they are not experiencing any nuclear fusion. However, white dwarfs are extremely hot when they first form. They do slowly cool, and as a result it is theorized that "black dwarfs"--ancient white dwarfs emitting no heat or light--could exist. However, it is estimated that it would take longer than the current age of the universe for a white dwarf to shed all of its energy, so none yet exist (or at least, they shouldn't!).
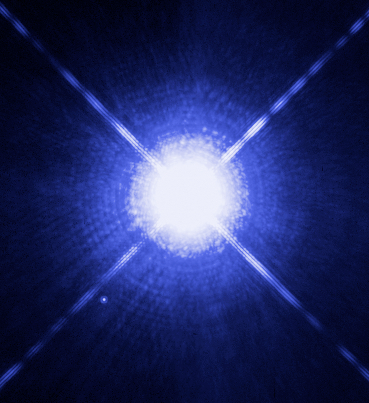
Sirius A and B, resolved by Hubble. Sirius A is a bright, nearby A type star (in fact, the brightest star in our sky), while Sirius B is a white dwarf (source).
It seems somewhat incredible that stars should fall so neatly into these categories (and, given that we're still tweaking and adding to the categories, it's clear that it's not that neat), but as we'll soon see when we look at the math behind it, it really does work. Plus, it stands up pretty well to empirical data:
Individual Milky Way stars with H-R regions overplotted (source).


Very nice post Tom :)
ReplyDelete