Sunday, March 30, 2014

The Virial Theorem, Part II: We Are Not Heated By Shrinkage

The Virial Theorem states that half of a gravitationally-bound system's potential energy goes into kinetic energy. It turns out that for a cloud of gas, the other half of $U$ goes into thermal radiation. We  know that the Sun started from the gravitational collapse of a giant cloud of gas. Let's hypothesize that the Sun is powered solely by this gravitational contraction, as was once posited by astronomers long ago. As it shrinks, its internal thermal energy increases, increasing its temperature and thereby causing it to radiate. How long would the Sun last if it was thermally radiating its current power output, $L_\odot = 4 \times 10^{33}$ erg s$^{- 1}$? This is known as the Kelvin-Helmholtz timescale. How does this timescale compare to the age of the oldest Moon rocks (about 4.5 billion years, also known as Gyr)?

The Kelvin-Helmholtz mechanism made an appearance in the last post, where we discussed how it played a role in the heating of exomoons, potentially rendering them uninhabitable. Here we're applying it to our star to see whether, at least when it comes to the age of the Sun, it's a viable way for the Sun to be producing its energy.

If we say that the Sun's thermal emission $E_T$ is equal half of the Sun's potential energy, we can (thanks to the legwork we did in the first post on the Virial Theorem) state that \[T_E = \frac{3GM_\odot^2}{10R_\odot}\] Plugging in the relevant constants gives us \[\frac{3(7 \times 10^{-8}) (2 \times 10^33)^2}{10(7\times 10^{10})} = 1.2 \times 10^{48} \: \: \textrm{erg}\] Now we'll assume that the Sun has been constantly producing its current energy output, $L_\odot = 4 \times 10^{33}$ erg s$^{-1}$. Dividing $E_T$ by this value gives us how long the Sun would last if it were only capable of producing energy via the Kelvin-Helmholtz mechanism.\[\frac{1.2 \times 10^{48} \: \: \textrm{erg}}{4 \times 10^{33} \: \: \textrm{erg s}^{-1}} = 3 \times 10^{14} \: \: \textrm{seconds}\]Converting this to years gives us about $9 \times 10^6$, or 9 million, years. That may seem like a long time, but compared to real geological or cosmological time, it's nothing. If Moon rocks date back 4.5 billion years, then the Sun must too--so something else is powering our solar system.

Not currently shrinking (source).

Frying the Na'vi

In the foreground here is a moon called Pandora:


I should preface everything else in this post by explaining that Pandora is, rather emphatically, not real. Those of you who enjoy poorly-written-but-visually-spectacular movies as much as I do will recognize it as the setting of James Cameron's Dances with Wolves remake Avatar. For those of you who don't, it is worth explaining that Pandora is the habitable moon of a Jupiter-sized gas giant, visible in the background above--it even has an analog of the Great Red Spot, though (like nearly everything else in the movie) it's blue.

Habitable moons pop up all over the place in science fiction, from Avatar to Star Wars to certain works of Robert Heinlein. However, the planet they're orbiting (which is almost invariably a gas giant) seldom exists as more than a dramatic backdrop to the immediate setting. This, as it turns out, is a bit problematic. A recent paper by RenĂ© Heller and Rory Barnes at McMaster University and the University of Washington points out that, while past studies of exomoon habitability largely ignored the evolution of a given moon's orbit and of its parent planet, these factors are critically important over the first billion years after a planet-moon system's formation.

Part of the key to this study is that, as gas giants form, they shrink and cool. Thus, a gas giant in a distant solar system (the study used the example of a 13-Jupiter-mass planet and an Earth-sized moon) would be significantly larger in its early years. Among other things, this would translate to more light being reflected from the system's star onto any potentially habitable moons, which means more energy (and thus, heat) being received by the moon in the form of flux. Combined with this reflected flux is energy produced by the Kelvin-Helmholtz mechanism, where a planet cools and shrinks, then heats up as a result of compression and expels heat (Jupiter produces more energy via this mechanism than via reflected solar flux). Combining this with the tidal heating that all moons undergo and flux from the system's star leads to a lot more heat than past models have evidently accounted for. A possible result of this is that the water on a newly formed potentially habitable moon would begin to evaporate more quickly than it could precipitate. Water is a heck of a greenhouse gas, trapping heat much more effectively even than carbon dioxide or methane. As a result, as the exomoon's water evaporated, it would heat up even more, leading to more evaporation, and so on and so forth in a runaway greenhouse effect--this process is how our sister planet Venus became the scorched hellscape that it is today.

The surface of Venus, imaged by the Venera 13 lander in 1982. The lander lasted for just over two hours, enduring a temperature of 457 degrees C and pressure of 89 Earth atmospheres, before it ceased transmitting (source).

In order to escape Venus' fate, an exomoon must exist in a kind of secondary habitable zone around its parent gas giant (assuming it already exists within its star's habitable zone). The closer to the inner edge of the stellar habitable zone the planet and moon are, the farther from the planet this limit becomes--in the case of the 13-Jupiter-mass planet and Earth-sized moon, the moon can orbit no closer than 28 Jupiter radii (for reference, Callisto, the most distant of the Galilean Moons, orbits Jupiter at a distance of about 26 Jupiter radii). Moons inside of this orbital limit would be in danger of losing any water that might exist on them, along with any chance of being habitable, in the first few million years of their existence. Settling an exomoon is a cool idea, and one we'll no doubt see again in sci-fi movies. But next time you see one, see how close it looks to its parent planet. That should tell you whether the director did his homework.

One last note: over the course of researching this post, I came across this page from the Center for Astrophysics, for a project called the Hunt for Exomoons with Kepler (HEK), which uses the exact same still from Avatar that I did. So minus points on me for unoriginality, but bonus points to CfA researchers for doing some seriously cool research.

It Almost Seems Too Convenient: The Virial Theorem

a) Consider a spherical distribution of particles, each with a mass $m_i$ and a total (collective) mass $\displaystyle\sum\limits_{i}^N m_i = M$, and a total (collective) radius $R$. Convince yourself that the total potential energy $U$ is of the form\[U=-\frac{GM^2}{R}\]

Let's first examine what it is we mean by a "spherical distribution of particles." It doesn't actually matter how densely packed all of these particles are--this could be a globular cluster, or it could be a single star. The key is that all of the component parts--whether they're stars or atoms--are evenly distributed across a spherical volume.

Pictured: A spherical distribution of particles (source).

In order to find the total potential energy of the sphere, we're going to integrate out from the center, summing the potential energies of spherical shells. Gravitational potential energy is defined as $U = -\frac{GMm}{r}$, where in the case of a spherical shell, $M$ is the mass enclosed by the shell, $m$ is the mass of the shell, and $r$ is the radius of the shell. Our first step, then, should be to define each of these terms for a given shell at radius $r_i$.

$G$ is constant, which makes our lives a bit easier. $M_i$ is going to be the volume enclosed by the spherical shell ($4/3 \pi r_i^3$) multiplied by the density of the distribution, which we can describe by dividing its total mass, $M$, by its total volume, $4/3 \pi R^3$ (where $R$ is the total radius). However, for simplicity's sake, we'll just plug $\rho$ into the equation for $\frac{M}{4/3 \pi R^3}$, giving us $M_i = 4/3 \pi r_i^3 \rho$.

Next we need to look at the mass $m_i$ of the spherical shell with radius $r_i$. If we were to integrate by mass, this quantity would simply be $dm$. However, since ultimately we're going to integrate by radius, we need to define it further. We'll take the usual approach when integrating by summing spherical shells and describe the volume of a given shell as its surface area times its width, or $4 \pi r_i^2 \times dr$. Multiplying this by density once again gives us $m_i = \rho 4 \pi r_i^2 dr$. Putting everything together now gives us an equation for the potential energy $U_i$ of a given spherical shell.\[U_i = -\frac{G \times 4/3 \pi r_i^3 \rho \times \rho 4 \pi r_i^2 dr}{r_i} = -\frac{16 \pi ^2}{3}(G r_i^4 \rho^2 dr)\] Now we're going to want to integrate, in order to go from the potential energy of a single shell to the overall potential energy of the distribution--as such, it makes more sense to describe $U_i$ as $dU$ on the left side of the equation. On the right, we're integrating radii from 0 out to $R$, so everything else is a constant that we can pull out. This gives us \[\int dU = -\frac{16 \pi^2 G \rho^2}{3} \int_0^R r^4dr\] The left integral just comes out to $U$, while the right integral comes out to $1/5 R^5$. Including all of the constants, then, we have \[U = -\frac{16 \pi^2 G \rho^2 R^5}{15}\] The last step is to recall that we defined $\rho$ as $\frac{M}{4/3 \pi R^3}$ and substitute back in for it. Once we do so, this mess of algebra quickly collapses into exactly what we were looking for.\[U = -\frac{16 \pi^2 GR^5M^2}{15(\frac{16}{9})\pi^2R^6} = -\frac{9GM^2}{15R} = -\frac{3GM^2}{5R}\] Exactly the form we wanted, with a coefficient of $3/5$ thrown in for good measure. This makes a great deal of sense, since most of the particles in the distribution are closer to the outside (imagine the number of particles in a spherical shell at the edge compared to the number in a spherical shell near the center).

b) If the average speed of a star in a cluster of thousands of stars is $<v>$, give an expression for the total mass of the cluster.

Star clusters are pretty cool objects. They range from tightly bound globular clusters in the galactic halo, composed of hundreds of thousands of ancient stars, to less numerous, looser associations of bright young stars. Of the former, the most famous is probably Messier 13, the Great Globular Cluster in Hercules, while of the latter the most well-known is almost certainly the Pleiades, a collection of brilliant blue stars in Taurus.

The Great Globular Cluster (source) and the Pleiades (source).

In order to figure out the mass of our cluster, we're going to use the Virial Theorem to which the title of this post refers. The Virial Theorem is both deceptively simple and incredibly useful. All it states is that the kinetic energy of a collection of matter bound by a force that follows an inverse-square law (gravity is a good, and applicable, example of such a force) is equal to half of its potential energy (multiplied by -1). In math-ese, this means that\[K = -1/2U\]. Now we need to apply this to the problem at hand. We know the potential energy, since we found that in the last part: $-\frac{3GM^2}{R}$, where $M$ and $R$ are the mass and radius of the cluster, respectively. The total kinetic energy, meanwhile, is the number of stars (which we'll call $N$) multiplied by the average mass of a given star, $m$ and the average velocity of a given star--$v$ (all multiplied by 1/2). All of this put together and plugged into the Virial Theorem gives us \[-\frac{3GM^2}{10R} = \frac{Nmv^2}{2}\] Now it's just a matter of solving for $M$--which is substantially easier when we note that $N \times m = M$, allowing us to cancel an $M$ from each side. A few algebraic steps give us a final expression for $M$.\[M=\frac{5Rv^2}{3G}\]

c) The cluster M80 has an angular diameter about 10 arcminutes and resides about $10^4$ parsecs from the Sun. If the average velocity of a star in M80 is $<v> \approx 10 \textrm{km s}^{-1}$, Approximately how much mass, in solar masses ($M_\odot$), does the cluster contain?

Our first step here is to figure out the radius of the cluster, which we can do using its angular diameter and distance by solving the very familiar small angle approximation $\theta=2R/D$ for $R$, where $\theta$ is the cluster's angular diameter, $D$ is its distance, and $R$ is its radius. We can then plug in $\frac{\theta D}{2}$ in for R in the equation we derived for $M$ in the last part, giving us $M = \frac{5\frac{\theta D}{2}v^2}{3G}$.

The cluster M80 in Scorpius. M80 is notable for containing numerous blue stragglers, one of which is easily visible just to the left side of the main body of the cluster (source).

From here, it's just a matter of inserting values for each of the constants and solving out (remembering to convert $10$ arcminutes into $3 \times 10^{-3}$ radians, $10^4$ parsecs into $3 \times 10^22$ cm, and $10$ km/s into $10^6$ km/s). This gives us \[M = \frac{5\frac{3 \times 10^{-3} \times 3 \times 10^{22}}{2} (10^6)^2}{3G} = 10^{39} /: /: \textrm{g} = 5 \times 10^5 \: \: M_\odot\] According to Wikipedia, this is dead on--score one for the Virial Theorem.

Credit goes out once again to Anne Madoff and Scott Zhuge for working through these tricky problems with me.

Saturday, March 29, 2014

The Ideal Gas Law, Free-Body Diagrams, and the Interiors of Stars: Hydrostatic Equilibrium

A Hydrostatic Haiku:
Gravity Pulls Down
Down, Inexorably Down
P briefly impedes

Consider the Earth's atmosphere by assuming the constituent particles comprise an ideal gas, such that $P = nk_b T$, where $n$ is the number density of particles (with units cm$^{-3}, k_b = 1.4 \times 10^{-16}$ erg K$^{-1}$ s is the Boltzmann constant. We'll use this ideal gas law in a bit, but first:

a-b) Think of a small, cylindrical parcel of gas, with the axis running vertically in the Earth's atmosphere. The parcel sits a distance $r$ r from the Earth's center, and the parcel's size is defi ned by a height $\Delta r < < r$ and a circular cross-section area A. The parcel will feel pressure pushing up from gas below ($P_{up}  P(r)$) and down from above ($P_{down} = P(r+\Delta r)$).  What other force will the parcel feel, assuming it has a density $\rho$ and and the Earth has a mass $M_\oplus$. Make a drawing of this.

Here, we're looking at a snapshot of an object. At this point, it doesn't matter whether the cylindrical parcel contains gas, the new Kindle you ordered (dropped from one of Amazon.com's drones), or a cylindrical cow. Whatever it is, it has a cross-section $A$ and a height $\Delta r$, and it's in the air--floating, rising, falling, it doesn't matter yet--at a height $r$.

What we want to do now is draw a free body diagram of the forces currently acting on our object. As the problem's setup explains, there's both an upward and downward force exerted by pressure ($P_{up}$ and $P_{down}$). Finally, and perhaps most obviously, there's the force most of us would think of first when considering what'll happen to an object floating in the air: gravity, $F_g$ (which, of course, is another downward force). Here's what it looks like:

Each force is labeled, with the arrows pointing in the direction in which they are acting.

c) If the parcel is not moving, give a mathematical expression relating the various forces, remembering that force is a vector and pressure is a force per unit area. 

Our next step is to essentially treat this like a static equilibrium problem, setting the sum of the upward forces equal to the sum of the downward forces (multiplied by negative one, since they are pointing in different directions) so that the parcel can sit where it is without moving. Pushing down on it we have $F_g$ and $P_{down} \times A$ (since pressure acts on the entire top surface area), while $F_{up} \times A$ is pushing up (again, because the upward pressure is distributed over the bottom surface). So, in its most general form, the expression we're looking for is \[F_g + P_{down} = -P_{up}\]

d-e) Give an expression for the gravitational acceleration, $g$, at a distance $r$ above the Earth's center in terms of the physical variables of this situation. Finally, show that \[\frac{dP(r)}{dr} = -\rho g\] This is the equation of hydrostatic equilibrium. What does it ``say" in English? Does it make sense? 

What we need to do here is figure out exactly what each of the terms in that last equation is. $F_g$ is defined as mass, $m$, times gravitational acceleration, $g$. On Earth's surface, $g$ is right around 10 m s$^{-2}$, but in order to generalize this we need to go a step farther back to the actual equation for $g$, $g = -\frac{GM}{r^2}$. In this case, since we're talking about the Earth, $M$ is $M_\oplus$, so $g = -\frac{GM_\oplus}{r^2}$. Now let's factor this into $F_g$. If we define the density of the gas in the parcel to be $\rho$, then mass is density times volume--or $\rho A \Delta r$, meaning $F_g = -\rho A \Delta r \frac{GM_\oplus}{r^2}$. However, for visual simplicity's sake, let's just keep $\frac{GM_\oplus}{r^2}$ as $g$, meaning $F_g = -\rho A \Delta r g$.

Next, let's consider how pressure is behaving and put all of this together. The problem's setup defines pressure as a function of height, $P(r)$, so $P_{up} = P(r)$ and $P_{down} = -P(r + \Delta r)$. Plugging these back into the general equation, we have \[P(r) A= -P(r + \Delta r) A - \rho A \Delta r g\] This can, however, be simplified quite a bit. Let's begin by putting the pressure terms on one side and canceling out each A, giving us \[P(r)+P(r+\Delta r) = - \rho \Delta r g\] Next, let's divide both sides by $\Delta r$, so that we have \[\frac{P(r)+P(r+\Delta r)}{\Delta r} = - \rho g\]This may look familiar to some folks as the definition of the derivative--so the entire left side is actually $\frac{dP(r)}{dr}$!. Thus our final answer, which puts our package in static equilibrium (or, more properly, hydrostatic equilibrium) is\[\frac{dP(r)}{dr} = -\rho g\] This actually tells us quite a lot. The easiest way to think about it is imagining what happens to the equation overall as the various terms change. The denser (and thus, heavier) our parcel is, the more $P(r)$ changes as a function of $r$. If the parcel is in the air over a more massive planet, thus increasing $g$, $P(r)$ will change more if the parcel gets nudged slightly higher or lower.

Hydrostatic equilibrium is why our Sun, and other stars like it, do not contract due to their enormous gravity, nor do they expand due to the enormous pressure of their interior gas. The forces balance each other out (source).

f) Now go back to the ideal gas law described above. Derive an expression describing how the density of the Earth's atmosphere varies with height $\rho(r)$. Recall that $dx/x = dlnx$.

This is more or less a matter of plugging and chugging. We'll start by solving our final equation above for $\rho$ and plugging in $nk_b T$ for $P(r)$. Before we do, however, let's get rid of that $n$, reflecting the number density of particles, since it's just not a very useful or informative term, and we can represent it in terms of variables we're already using: mass and density (or more specifically, mass divided by density). This gives us \[\rho = -\frac{1}{g}\frac{d\rho}{dr}(\frac{ k_B T}{m})\] Next, let's solve for $dr$ on the left and get all of the constants and $\rho$ terms on the right, so that we have\[dr = -\frac{k_B T}{mg} \frac{d\rho}{\rho}\]. Now we'll integrate both sides to give us an actual function for $\rho (r)$. this is where that hint about $dx/x$ will come in handy, since that's exactly what we have on the right side of our equation (with $\rho$ in place of $x$). What we end up with, then, is \[r = -\frac{k_B T}{mg}ln(\rho) + c\] Where c is the constant resulting from integrating--we'll get to in a bit. However, what we need to do first is solve for $\rho$ (or more properly, $\rho (r)$, first by subtracting $c$ over to the other side and dividing by $-\frac{k_B T}{mg}$, then by raising $e$ to each side in order to get $\rho$ out of that natural log. This gives us \[\rho (r) = e^{-\frac{rmg}{k_B T} - c}\] Finally, we can pull that $c$ out of the exponent and make it a coefficient, and think about what it actually means. When $r=0$, $\rho (r)$ will just be equal to whatever that $c$ is, so really it's reflective of the "initial conditions" of our setup--more properly, $c = \rho_0$. Thus, our final expression is \[ \rho(r) = \rho_0e^{-\frac{rmg}{k_B T}}\]

This pretty neat graphic shows, among other interesting things, the fall-off in density of $N_2$, $O_2$, and $O$ at increasing altitude (source).

g) Show that the height, $H$, over which the density falls off by a factor of $1/e$ is given by\[H=\frac{k_BT}{\bar{m}g}\] where $\bar{m}$ is the mean mass of a gas particle. This is the \scale height." First, check the units. Then do the math. Then make sure it makes physical sense, e.g. what do you think should happen when you increase $\bar{m}$? 

Let's start with the unit check. $k_B$ has units of energy $\times$ temperature$^{-1}$, while $g$ has units of length $\times$ time$^{-2}$. $m$ and $t$ obviously have units of mass and temperature respectively, and $H$ has units of length, so the equation overall works out to\[\textrm{length} = \frac{\textrm{energy} \times \textrm{temperature}^{-1} \times \textrm{temperature}}{\textrm{mass} \times \textrm{length} \times \textrm{time}^{-2}}\] At first this doesn't seem to work out exactly right, until we realize that energy actually has units of its own--mass $\times$ length$^2$/time$^2$, to be exact. Thus, what we actually have is \[\textrm{length} = \frac{\textrm{mass} \times \textrm{length}^2 \times \textrm{time}^{-2} \times \textrm{temperature}^{-1} \times \textrm{temperature}}{\textrm{mass} \times \textrm{length} \times \textrm{time}^{-2}}\] Which simplifies to length = length.

Ok, so our units check out. From here out it's just a matter of setting $\frac{\rho (r)}{\rho_0} = 1/e$ and solving for $r$. First, we'll plug everything in for $\rho (r)$, giving us\[\frac{\rho_0e^{-\frac{rmg}{k_B T}}}{\rho_0} = 1/e\] Then, canceling $\rho_0$ and rewriting $1/e$ as $e^{-1}$ makes that into\[e^{-\frac{rmg}{k_B T}} = e^{-1}\] Finally, we can take the natural log of both sides in order to give us an equality with just the exponents, and then divide by $-\frac{mg}{k_B T}$ to solve for $r$, giving us \[H=r=\frac{k_B T}{mg}\]

h) What is the Earth's scale height, $H_\oplus$? The mass of a proton is $1.7 \times 10^{-24}$ g, and  the Earth's atmosphere is mostly molecular nitrogen, $N_2$, where atomic nitrogen has 7 protons and 7 neutrons.

This is relatively straightforward--all we need to do is calculate the mass of an $N_2$ molecule and plug it into the equation for $H$ we just derived. Two atoms, each holding 7 protons and 7 neutrons massing $1.7 \times 10^{-24}$ g each (neutrons and protons have approximately equal mass) comes out to $2( 2\ times 7 \times 10^{-24} \approx 3 \times 10^{-23}$ g. $g$ can be approximated as 10 meters/s$^2$--or $10^3$ cm/s$^2$ in more-familiar cgs units. We can set $T$ to be room temperature--around 300 Kelvin. Now it's just time to put it all together:\[H_\oplus = \frac{k_B T}{mg} = \frac{1.4 \times 10^{-16} \times 3 \times 10^2}{3 \times 10^{-23} \times 10^3} \approx 2 \times 10^6 \: \: \textrm{cm}\] This is about 20 kilometers, which is pretty high--twice the hight of an intercontinental flight (or of Mount Everest). However, even though the Earth's atmosphere continues up to around 100 km, it gets denser and denser the lower it is (hence why passenger jets need to be pressurized even flying at half this altitude), so 1/5 the total height seems like a very reasonable estimate of the Earth's scale height.

Special thanks to Anne Madoff and Scott Zhuge for collaborating with me on this problem.

Wednesday, March 26, 2014

Revisiting the Astro 16 Midterm

On March 11, I got to spend my afternoon tackling some pretty interesting problems (terrifyingly, without the aid of the Internet or even my ancient graphing calculator which, for some reason, is still kicking around). It generally went pretty well, but there were a few hiccups which I'll go over here.

To start with, problem four, and a return to Io. I started by calculating the semi-major axis of its orbit around Jupiter which, given its orbital period and the mass of Jupiter, could be found using Kepler's Third Law--it came out to $8 \times 10^{10}$ cm. Next, I did some work using the mathematics behind tides that we worked out here in order to determine the tidal force exercised by Jupiter on Io: $\pm 1.1 \times 10^{-2}$ g $\times$ cm $\times$ s$^{-2}$.

Finally, on the third part, I (predictably) got into some math trouble. In order to compare the tidal forces on Io due to Jupiter to those on Earth due to the Moon, I was trying to calculate the tidal force we experience here, just by fiddling with the constants in the tidal force equation. I got as far as \[\Delta F =  \frac{6 \times 10^2 \times 10^{-8} \times 10^8 \times 10^{25}}{6.4 \times 10^31}\] But, for once having to rely on my own brain rather than Stephen Wolfram's to do math, I mistakenly simplified it to $10^{-7}$ g $\times$ cm $\times$ s$^{-2}$, putting it a whopping five orders of magnitude below what Io feels due to Jupiter. In reality, we experience tidal forces of around $10^{-4}$ $ g $\times$ cm $\times$ s$^{-2}$--closer, but still a couple of orders of magnitude less than what Io's up against. Even moving Earth's and Io's predicaments that much closer, it still makes a great deal of sense that Io's extreme geological activity is thanks to the nearby tug of Jupiter.

Another image of Io, this one taken by the Galileo spacecraft. It is one crazy-looking planet (source).

The next issue, at the start of problem five, concerned converting keV (that'd be kiloelectronvolts) in to ergs--right off the bat, I dropped a factor of ten giving me $2 /times 10^{-9}$ erg where I should have had $2 \times 10^{-8}$ erg. I also made an arithmetic error when dividing this by $h$ in order to get frequency, $\nu$. As a result, I ended up with a photon energy of $3.5 \times 10^{17}$ Hz rather than what it should have been--$3 \times 10^18$. Thus, my final photon wavelength was $10^{-7}$ cm, rather than the correct answer of $10^{-8}$ cm, and an angular resolution of $2.5 \times 10^{-9}$ radians instead of the actual resolution of $2.5 \times 10^{-10}$ radians. However, this doesn't change the overall ranking of the three telescopes being compared in the problem (I calculated the resolution of a 5-meter telescope observing photons at 0.5 micron wavelength as $10^{-7}$ radians, and that of a kilometer-wide interferometer observing at 30 GHz as $10^{-5}$ radians. So A is still on top, resolution-wise. 

As a sidenote, A likely involves the most interesting engineering as well. X-rays, you might be surprised to find, tend to pass straight through most things, making conventional telescopes useless for such high-energy photons. As a result, when designing the Chandra X-Ray Observatory, NASA had to come up with a pretty nifty setup where the photons, rather than being reflected straight off a mirror, graze a series of angled mirrors in order to gradually alter their course into the detector. Chandra, one of NASA's Great Observatories, has been trucking along since 1999--despite only being planned to last until 2004. As an added bonus, it's operated from just across the street from where I'm sitting right now, at our very own Harvard-Smithsonian Center for Astrophysics.

Cutaway of the Chandra design (source).

Sunday, March 23, 2014

Determining the Astronomical Unit

BACKGROUND

The distance from the Earth to the Sun--the Astronomical Unit (AU)--is one of the most important fundamental constants in astronomy and astrophysics, most significantly as the basis of stellar parallax. Parallax is not the only means of measuring distances in space (in fact, since it is dependent on measuring angles it can only measure as far as our best telescopes have angular resolution): out at vast distances we are dependent on objects such as type 1a supernovae and Cepheid variable stars, whose luminosity (and with it, luminosity distance) can be objectively measured due to known properties that they have. However, without the definitive distance measurement offered by parallax, it would be impossible to "calibrate" measurements of such objects--we would be able to tell that there was a correlation between the period and luminosity of Cepheid variables, for instance, but we would only be able to measure their distance relative to one another without the parallax of nearby Cepheids grounding that scale in absolute distance. As such, parallax is the basis of the cosmic distance ladder, and the Astronomical Unit is the basis of parallax.

Parallax uses the relative positions of stars in the sky as the Earth orbits the Sun to determine distances. You can read more about it at the source.

The quest to measure the AU, however, dates back to long before stars were even known to have varying distances. Since nearly all of them relied on parallax of one object or another (the Moon, Sun, or planets) as viewed from different locations on Earth, every estimate until the late 1600s, when the Earth's radius was first accurately measured, was expressed in units of Earth radii. 

Parallax of Venus, measured during a transit of that planet, was used by many astronomers in the 1600s (source).

Our friend Aristarchus, whom we last encountered doing a reasonably accurate job measuring the size of the Moon, attempted to do so using the angle between a quarter moon and the Sun. Eratosthenes was the next to try, and--once again, depending on which type of stadion he was using--he either dramatically underestimated the distance or came within a few percent. In any case, the definitive value for the AU was, for many centuries, the one measured by Ptolemy using lunar parallax, which was only about one twentieth of the reality. Despite being so far off the mark, his value was more or less universally accepted until Kepler called it into question in the 1600s. Not long after, astronomers observing a transit of Venus from different locations on Earth attempted to measure the AU using solar parallax, pushing the generally accepted value of the AU to about half of what we now know it to be. The first relatively accurate measure of the AU finally came in 1672 at the hands of the astronomers Cassini and Richer (Christiaan Huygens produced a good estimate of it in 1659, but it seems he just got lucky--his methods were very flawed). Finally, more advanced methods using the speed of light, radar-gauged distances to Venus and Mars, and telemetry from space probes have continued to refine our knowledge of the AU--three additional decimal places of precision were added in 2009, giving us the AU to within $3 \times 10^{-7}$% uncertainty.

CALCULATIONS

Lacking a transit, interplanetary radar, or a space probe, we departed from historically treaded ground in order to measure the AU by new means. All of the equipment and direct observations we performed can be read about in my discussion of how we measured the rotational period, angular size, and rotational velocity of the Sun. With these constants in hand, it is simply a matter of combining them in the right way to reach a measurement of the AU.

Our first step was to determine the physical size of the Sun. Knowing the rotational period and velocity of the Sun at the equator, this became a simple problem of $D = vt$. Our distance $D$ was the circumference of the Sun, while the rate $v$ was the rotational velocity and time $t$ the rotational period, $p_\odot$. Since what we're really after is the radius of the Sun, we can plug $2 \pi r_\odot$ in for $D$ and solve for $r_\odot$, giving us $r_\odot = \frac{vp_\odot}{2 \pi}$. We'll plug in the actual values later--for now, it's more important to have everything in terms of known constants.

Next it was time to combine the radius and angular size in a relation involving distance. This was a simple matter of drawing a right triangle, with legs going from the center of the Earth to the center of the Sun and from the center of the Sun to the edge of the Sun, and a hypotenuse going from the edge of the Sun back go the Earth. The angle closest to Earth is the angular size of the Sun (which we'll call $\alpha$), the leg going across the Sun's face is its $r_\odot$, and the leg going from the Earth to the Sun is the AU.

If the circle on the right is the face of the Sun, $d$ is its diameter, $\delta$ is its angular size, and $D$ is the AU (source). Our triangle has legs $D$ and $d/2$, and an angle of $\delta / 2$ at the leftmost vertex (source).

These three quantities--two of which we know--can be related using trigonometry. Thanks to SOHCAHTOA, we know that the tangent of an angle is opposite/adjacent--in the case of $\alpha$, $r_\odot / 1$ AU. However, to get the exact proportions of our triangle right we need to divide $\alpha$ by two. Thus, 1 AU = $r_\odot / tan(\alpha)$. Plugging in for $r_\odot$ gives us 1 AU = $\frac{\frac{vp_\odot}{2 \pi}}{tan(\alpha / 2)}$.

Now, finally, let's plug in the constants we measured in the last three posts. $p_\odot$ we have as 26.3 days, $\alpha$ as 0.56 degrees, and $v$ as 0.9597 km/s. Thus,\[1 \: \: \textrm{AU} = \frac{\frac{(0.9597 \: \: \textrm{km/s})(26.3 \: \: \textrm{days})}{2 \pi}}{tan(0.28 \: \: \textrm{degrees})} = 7.1 \times 10^7 \: \: \textrm{km}\]

CONCLUSIONS

We entered into these calculations aware that we were carrying in a significant amount of error from our past measurements, particularly from our measurement of $v$, the rotational velocity of the Sun. However, given that we knew that value to be just under half of the literature value, it then meets our expectations to see that our result of $7.1 \times 10^7$ km is about 47% of the current literature value for the AU. While the error affecting our earlier observations and calculations of $p_\odot$, $v$, and $\alpha$ was significant, particularly in the case of $v$, it seems that our mathematical methodology here has introduced no further error. Thus, if the component observations were to be repeated in such a way as to minimize the error we encountered, it is likely that repeating the calculations above would provide an accurate value of the AU. Furthermore, while a factor of two is quite large for measuring distances within the solar system (if NASA were to send a probe to the Sun assuming it was half as far away as it really is, they'd be in trouble), a factor of two would land more significant measures of distance using parallax and other cosmic distance rulers comfortably within an order of magnitude of the reality. While our experiment here was not wholly successful in producing an accurate measure of the AU, future iterations of it, adjusted to account for the error we encountered, should be able to accurately gauge the AU using a novel methodology.

Friday, March 21, 2014

Determining the Rotational Velocity of the Sun

BACKGROUND

The third component necessary for us to measure the astronomical unit is the rotational velocity of the Sun. Like essentially all celestial objects, from dwarf planets to galaxies, the Sun rotates on its axis. The Sun was born when a cloud of gas collapsed into a protostar and protoplanetary disc, all of which spun in concert. Then, gradually, the protostar ignited into the ball of nuclear fusion we know and love, and the protoplanetary disc came together to form planets, moons, and asteroids.

An artist's conception of a protoplanetary disc like the one that evolved into our solar system (source).

Despite no longer being a uniform cloud of gas, the solar system's objects have preserved the angular momentum of the primordial solar system, which is why nearly all of the objects in the solar system orbit the sun and rotate on their axes counterclockwise when viewed from the North Celestial Pole (with some notable--and cool--exceptions). Billions of years later, the orbits of the planets are dictated by some by-now very familiar laws, but the momentum driving the planets around their axes--and around the Sun--is the same as that of our solar system's earliest days.

EQUIPMENT AND OBSERVATIONS

Once again, the heliostat played a major role in our observations, allowing us to relay focused sunlight into our lab. However, in this case we were not simply focusing the image of the Sun onto a page (either horizontal or vertical), but rather into the slit of a spectrograph. Upon entering the slit, the light then shone through a diffraction grating, which splits light up by frequency according to the grating equation, $m \lambda = d(sin\alpha + sin\beta)$, where $\lambda$ is wavelength, $d$ is the distance between slits in the grating, and $\alpha$ and $\beta$ are the angles of incidence and diffraction, respectively. Since the light that enters a diffraction grating is dispersed into orders, $m$ is the number of the order--this principle should look familiar to anyone who has examined the basic geometry of Fourier optics. However, when using a diffraction grating rather than a simple pair of slits, light is subdivided into each frequency within each order.

Basic scheme of a diffraction grating (source). A great tool for investigating how diffraction gratings work is also located here.

Once sunlight is directed into the slit, it becomes possible to place an eyepiece onto the front of the spectrograph and visually examine the spectrum of the Sun. My stalwart colleague Anne Madoff produced a beautiful image of the result, shown below.

You should all check out the outstanding blog located at the source.

However, our interest in the Sun's spectrum was not related to how impressive it looks, but rather in how it is affected by Doppler shift. Just as an approaching ambulance's siren sounds higher-pitched because its sound waves are crowded together (resulting in a shorter wavelength and higher frequency), and once the ambulance is driving away its siren sounds lower-pitched for the opposite reason, light waves are Doppler shifted to higher or lower wavelengths if the source is moving toward or away from the observer. blueshifted (Doppler shifted to a bluer point on the spectrum, with lower wavelength and higher frequency), while a spectrum taken on its eastern limb is slightly redshifted (Doppler shifted to a redder point on the spectrum, with higher wavelength and lower frequency).

Doppler shift (source).

 While our distance from the Sun is staying pretty much constant, one edge (or, more technically, "limb") of the Sun is rotating toward us, while the limb opposite is rotating away. Thus, the spectrum of the Sun when taken on its western limb is slightly

Redshift and blueshift (source).

Thus, in order to determine the rotational velocity of the Sun we could take spectra at the eastern and western limb of the Sun's equator (since it is rotating the fastest at its equator) and measure the offset between the wavelength of a given spectral line in each measurement--in our case, we used the NaD (sodium) lines with wavelengths 5889 and 5896 angstroms. Thus, our first step was not directly observing the spectrum of the Sun, but rather setting up a CCD camera and recording images of the spectrum of a sodium lamp in order to focus the camera on the region of the spectrum where the NaD lines fall. This is a delicate process involving more than simply aiming the camera at the right spot on the spectrograph's screen. Once the CCD was in essentially the right place, we then had to move it carefully toward and away from the spectrograph in the tiniest increments possible, recording an image after every movement in order to achieve the sharpest possible focus. This process involved dozens of tiny movements and test images, and only when it was complete could we remove the sodium lamp and aim sunlight into the spectrograph.
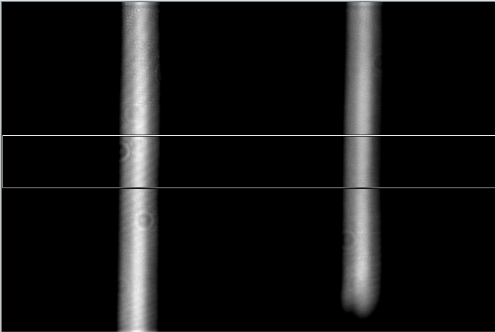
The Sodium NaD lines, as seen while focusing the CCD. We took an enormous number of images like this one, making minute adjustments to the position of the CCD after each one in order to achieve the sharpest possible focus on the two lines.

However, since the orientation of the Sun in our sky varies as a result to the Earth's axial tilt (and, on top of that, the heliostat inverts the image of the Sun), it is not immediately apparent where the Sun's equator is. In order to determine this, we took pairs of images (in order to give us a sample size of two, rather than one) at eight different locations on the edge of the Sun--the top and bottom, left and right, upper left and lower right, and lower left and upper right. MaximDL, our image processing software, then exported the spectral data (flux at each wavelength) to a Microsoft Excel file, where we were able to create a normalized plot overlaying all of our sets of observations in order to see which two points had the greatest offset--in our case, this was the upper right and bottom left. The line connecting these two points was assumed to be the equator of the Sun, and the two points themselves the western- and easternmost limbs of the Sun.
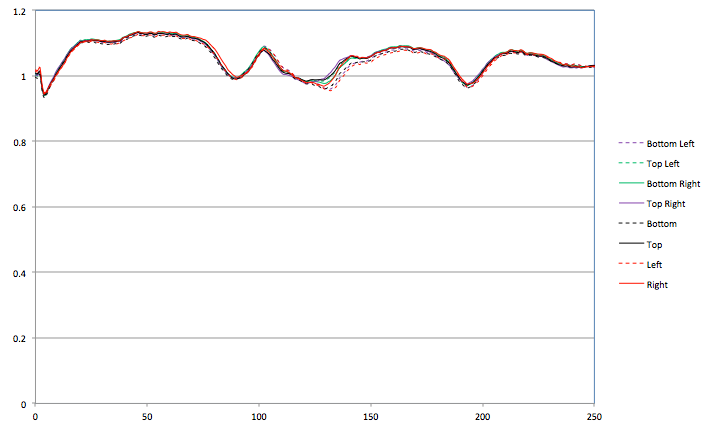
One of the two normalized plots of our observations. Note the variation between data series in the middle spectral line (to the left is an unshifted atmospheric water line).

From there, we could plot each of the NaD lines as observed at each point, fit a second-degree polynomial to each using Excel's fitting utility, and then calculate the center of each line from its trendline equation as $-\frac{b}{2a}$. Subtracting the location of a given line as observed at the western limb from its location as observed at the eastern limb gave us (in pixels) the offset between them. Since our detector's pixel scale was .017428 angstroms/pixel, we could then multiply our offset in pixels by .017428 to calculate the offset in actual wavelength. We could then plug that change in wavelength into the equation for Doppler shift, $\frac{\Delta V}{c} = \frac{\Delta \lambda}{\lambda_0}$, where $\Delta V$ is the change in velocity between the two locations, $c$ is, as usual, the speed of light, and $\Delta \lambda$ and $\lambda_0$ are the change in wavelength and rest-frame wavelength, respectively, of the observed spectral line. Next, we divided $\Delta V$ by two, since the resultant $\Delta V$ is actually the difference in velocity between the approaching and retreating limbs of the Sun rather than the speed with which one limb is approaching or retreating. Each of the two NaD lines was examined separately, and then the two resultant velocities averaged.

The last step was to apply a final calibration based on examination of a telluric (literally, "of the Earth") water line--a spectral line produced by sunlight being absorbed by atmospheric water. Since this line was produced by our own atmosphere, it was unshifted. However, there was still a discrepancy between the telluric line as it appeared in the spectrum from the upper left and from the lower right. This discrepancy was measured in the same way as the $\Delta \lambda$ of the NaD lines, and the resultant figure applied as a conversion factor to our measured velocity.

RESULTS AND CONCLUSIONS

Since we observed two separate lines in two different sets of observations (since all images were taken in pairs), we essentially had four sets of data to work with. Integrating all of our observed doppler shifts and applying the calculations detailed above gave us the data shown below.


While $n=4$ is still a fairly low sample size, the $\Delta \lambda$ for each of the two NaD lines agreed very closely with one another within each set of images, as did the resultant rotational velocities between the two sets of observations--which average to 0.9597 km/s. Strictly speaking, rotational velocity should be measured in degrees or radians per second; however our measurements were of the linear velocity toward or away from the Earth, and a rotational velocity in km/s will prove vital in future calculation of the physical size of the Sun.

Despite the consistency of our measurements, however, they do not agree closely with literature values of the rotational velocity of the Sun at the equator--approximately 2 km/s. Our observations yielded almost exactly half of that value. As usual, several sources of error could have contributed to this, and as usual, simple human error is foremost among them. While the mathematical basis of our calculations was sound, there were opportunities for flawed measurements, perhaps most notably when lining up the four different axes across which the rotational velocity could be measured. It was difficult to get exactly the right point on the Sun's disc on the slit for each measurement, and it is likely that some, if not all, of the pairs were not directly across from one another. Even if they were, it is possible that the Sun's equator might lie between two of the measured axes. Both of these circumstances would lead to a lower measured rotational velocity than the reality. Finally, our sample size of two was unquestionably inadequate, and indeed only comprised two separate sample sizes in some specific senses. Were our experiment to be repeated, it would be vital to do multiple iterations of it start to finish, particularly the process of lining the disc of the Sun up onto the slit of the spectrograph (which was only done once in our case, with images taken in pairs). Repeating this phase of the experiment would likely eliminate much of the considerable error discussed above. Aside from the limitations imposed by a small number of trials, however, our overall methodology was quite sound--particularly concerning the reduction of data once taken--and could be usefully employed in future experiments of a similar nature.

Wednesday, March 19, 2014

Determining the Angular Size of the Sun

BACKGROUND

The angular size of the Sun is a relatively easy constant to both explain and determine, which is fortunate, as it is vital in calculating the Astronomical Unit. Angular size in general is the angle occupied by (or, to use the technical term, subtended by) a given object in one's field of view--for instance, a person's pinky typically subtends about one degree when held at arm's length.

Definitely not to scale. However, the Moon does look a lot bigger than it really is--in reality it only subtends about half of a degree (Source)

This is actually a reasonably good way of estimating the angular size, or any angular distance, such as altitude--the angle between the horizon and an object in the sky. However, since staring at the Sun is generally not a recipe for success, it's not recommended in this case. Fortunately, measuring the angular size of the Sun is not a terribly difficult process, particularly given the equipment at our disposal.

EQUIPMENT AND OBSERVATIONS

The heliostat was once again the centerpiece of our observations, and we utilized it in much the same way as described here, with one critical and enormous difference: rather than focusing the Sun's image onto a piece of paper on a table, we focused it onto a piece of paper on an easel. Keeping the heliostat's tracking in operation, we again drew the outline of the Sun onto the easel, then disabled the tracking motor and allowed the Sun to drift. However, rather than watching for the movements of sunspots, we gauged the movement of the Sun's disc as a whole, recording the time it took for it to drift its width (so that its left side lined up with the original position of its right side). This process was performed and the time recorded twice; in both cases it was 00:02:14.

RESULTS AND CONCLUSIONS

Since the Sun moves through 360 degrees on the Earth's sky (approximately) every 24 hours, it was then possible to relate the time taken by the Sun to drift its width ($t_w$), divided by 24 hours, to its angular size ($a_{circledot}$), divided by 360 degrees, as shown below.\[\frac{t_w \: \: \textrm{seconds}}{24 \: \: \textrm{hours}} = \frac{a_{\odot} \: \: \textrm{degrees}}{360 \: \: \textrm{degrees}}\] We then converted 24 hours to seconds and solved for $a_{\odot}$. Since our two trials yielded the same $t_w$, both gave us the same $a_{\odot}$, .56 degrees. This holds up well under a sanity check, as the full Moon (for which one can use the pinky-measuring method) subtends about half a degree on the sky, and the angular size of the Moon and Sun are approximately the same.

Since the angular sizes of the Moon and Sun are so similar, it is possible for the Moon to exactly cover the Sun during a total solar eclipse (Source)

Error was certainly a factor in our observations, particularly given that we performed only two trials. It is difficult to say definitively whether or not our measured $t_w$ would have shown more variations given more measurements. If we were to repeat our observations, it would definitely be important to perform more trials. However, the check with the more directly measurable size of the Moon does lend confidence to our result. Furthermore, while the eccentricity of Earth's orbit does affect how large the Sun appears in our sky, it does so at a level more precise than that of our measurements, so it is possible to generalize our $a_{\odot}$ for the entire year.

Monday, March 10, 2014

Determining the Rotational Period of the Sun

BACKGROUND

Knowing the rotational period of the Sun $P_\odot$ is necessary in order to measure the physical size of the Sun, and in turn its distance from the Earth--for that reason alone, it is an interesting and worthwhile quantity to pin down. However, the rotational period of the sun is of interest in and of itself as well. The Sun plays host to massive amounts of charged plasma rising and falling within its interior. All of these particles are also rotating as the Sun turns--at varying rates depending on latitude, since the Sun is composed entirely of gas and plasma--making the system into a massive dynamo. The resulting electric field in turn is responsible for the Sun's magnetic field, which is responsible for the many effects clumped under the term solar activity--including sunspots (which will be very important momentarily), solar prominences and coronal mass ejections, and the aurorae (borealis and australis for the northern and southern lights, respectively). While our observations of the Sun's rotational period were undertaken as a component toward measuring the astronomical unit, knowing $P_\odot$ lays valuable groundwork for future investigation of the behavior of the Sun.

Left: The aurora borealis as seen (during the Perseid meteor shower!) in Colorado (Source)
Right: A 2012 solar prominence, which resulted in a CME (Source)


EQUIPMENT AND OBSERVATIONS

The key element of our observations was a system of mirrors functioning as a heliostat--a device which turns, compensating for the rotation of the Earth in order to constantly reflect light from the Sun at the same place. In our case, the heliostat reflected light from outdoors through an open window (leaving the window closed would diffract the light and complicate observations) onto another set of mirrors, which focused the reflected light from the Sun onto a piece of paper--and from there, our retinas. Setting up the heliostat required aligning sunlight through a pair of pinholes in order to ensure (without staring straight at it) that the Sun was shining on the primary mirror. The secondary mirror was then aimed at yet another mirror inside, which reflected onto a fourth mirror on a table, which in turn sent the light to a final mirror which reflected it down onto the paper on the surface of the table. Moving the last mirror closer to and farther from the penultimate one focused the image of the Sun--which, despite having been bounced all over the room, was still so bright that we needed to wear sunglasses when looking at it.

The heliostat. This image does not show the indoor mirrors that were used in tandem with those shown. (Source)

Throughout this process, the heliostat's motor was engaged, keeping the image stationary. After focusing the image of the Sun, we traced its outline onto the paper, and labeled all identifiable sunspots. Once this was done we turned off the heliostat motor, allowing the Sun to drift across the page as the Earth rotated. Tracing the line along which the sunspots drifted provided the terrestrial east-west line.

We repeated this process two more times, each a week apart. Once we had identified the same sunspots at various times, we could overlay the images (using the terrestrial east-west line to ensure that they were identically oriented) with a latitude-longitude grid identical to the one shown in order to see how the position of each sunspot on the disc of the Sun had changed since the last observation.

A solar latitude-longitude grid similar to the one we used. (Source)

RESULTS

Having tracked the position of a given sunspot from one week to the next, we could measure the angular change of its position on the face of the Sun itself. We could then set up the following relation between $\Delta t$--the change in time from one observation to the next--and $\Delta \theta$--the change in position. \[\frac{\Delta \theta}{360} = \frac{\Delta t}{P_\odot} \: \: (1)\] We collected data on five sunspots, which we labeled A, B, C, E, and F (another sunspot D was observed, but only at one point in time); the data for each is shown below.

Fig. 1: Observed $\Delta t$ and calculated $P_\odot$

Altogether, the (admittedly, widely variable) quantities measured for $P_\odot$ yielded an average value of 28.3 days. However, what we are measuring here is not exactly the rotational period of the Sun--at least, not the one we're looking for. It is possible to define two separate rotational periods for the Sun: the sidereal and synodic rotational periods. The sidereal period is the time it takes for the Sun to rotate once on its axis, and it's what we want, at least for the purposes of calculating the physical size of the Sun down the line. The synodic period is the time it takes for a point on the Sun to make a full revolution with respect to the Earth. Since the Earth is orbiting around the Sun in the same direction as its rotation, this requires a spot on the Sun to make a full rotation, and then continue rotating to catch up with the progress Earth has made in its orbit. The relation between sidereal (which we will continue to refer to as $P_{\odot}$) and synodic ($P_{sy, \odot}$) periods can be roughly expressed as follows:\[P_{sy, \odot} = P_{\odot}(1+\frac{R_{sy, \odot}}{365}) \: \: (2)\] If we plug in our average value for $P_{sy, \odot}$ of 28.3 days and solve for $P_{\odot}$, giving us a sidereal period of 26.3 days.

CONCLUSIONS

Clearly, our observations included a great deal of error, as our seven calculated values of $P_\odot$ varied from 14 to 48 days--giving us a hefty standard deviation of 13.2 days. This was likely the result of human error and our imprecise methodology, as the grid-overlay method of measuring $\Delta \theta$ by eye was extremely approximate. While it is difficult to accurately project and measure angular change over a sphere on a flat surface, if we were to repeat the process with the goal of improving accuracy, a more precise method would be needed. Additional measurements would also help to narrow down the value to a more accurate average.

However, this is actually a much more complicated problem than it initially presents as. As was previously mentioned, the Sun rotates at different rates over varying solar latitudes, and the variation in rotation rate rate for sunspots of higher or lower latitude. This motion is dependent on the Sun's rotation, but goes unaccounted for in our measurements.

However, our average $P_\odot$ of 26.3 days is a very good estimate of the literature value for the Sun's equatorial rotation period, 24.47 days. Thus, while the error inherent in our measurements was substantial, the seven trials we performed yielded an average which, while in need of significant refinement, serves as a fair estimate of the Sun's sidereal rotation period.

Wednesday, March 5, 2014

Tides Gone Wild

So, now we understand tidal forces. That's great--I've found that every bit of knowledge I've gained that helped me understand the world around us has given me that much more appreciation of the world. Arcane as the math may seem, I think it's pretty cool that, next time I'm down at the beach, I'll understand the real reasons why the tides behave the way they do. However, a few meters of water gently rising and falling isn't all that exciting. Interesting, sure. Definitely useful to some people. But not thrilling.

You know what is thrilling? Ripping asteroids, comets, moons, and even planets to shreds.

As we saw, a tidal force pulls in opposite directions on a planet (or any other body experiencing tides). On Earth, that's good for two high tides a day. The Moon, tidally locked to the Earth, gets a tidal bulge that keeps it an ellipsoid rather than a spheroid. In the Earth-Moon system, tidal forces don't do a whole lot else. Everything is too small, and too far apart.

Instead, lets head back to our old friends the Galilean moons. Rather than Ganymede, though, or it's oft-discussed companion Europa,* we're going to be talking about Io.

Yes, it really does look like that. (Source)


Currently, Io is orbiting around 400,000 kilometers away from Jupiter--just a bit farther than the Moon is from the Earth.  The innermost of the Galilean moons, Io is wracked by tidal forces, between the immense of Jupiter and the competing tugs of planet's other moons. This results in Io being the most geologically active body in the solar system. Over 400 volcanoes dot its surface, some, Voyager revealed, higher than Mount Everest. Io has suffered abuse on a truly cosmic scale.

So let's abuse it some more. Specifically, let's shrink its orbit down to around 1/12 its current size. All of a sudden, poor Io is now orbiting a mere 30,000 kilometers away from Jupiter. Obviously, the tidal force of Jupiter is going to be a lot stronger now. So much stronger, in fact, that Io is going to get torn to pieces. Once an orbiting body gets inside of a certain radius, called the Roche Limit (for the French astronomer who first theorized it), the tidal forces pulling it in opposite directions are actually stronger than the gravitational forces keeping it together.

As an object passes inside the Roche limit, gravity can no longer hold it together. It stretches out and disintegrates (Source)

There are a few different approximations for calculating this distance (once one begins taking into account factors such as the deformation of the orbiting body into account, the math gets extremely complex). However, Roche himself approximated the Roche Limit, $D_R$, as \[D_R = 2.44R_p(\frac{\rho_p}{\rho_s})^{1/3}\] Where $R_p$ is the radius of the primary, $\rho_p$ is its density, and $\rho_s$ is the density of the satellite. In the case of Jupiter and Io, this gives us $D_{R, J, I} = 3.6 \times 10^8$ meters. Orbiting closer than that, Io would get torn apart.

This doesn't happen often--unsurprisingly, Io isn't likely to suddenly start orbiting at a fraction of its current distance. But seldom doesn't mean never. When the fragments of comet Shoemaker-Levy 9 slammed into Jupiter in 1994, it was determined that it was (unusually) a Jupiter-orbiting comet, and that it had actually broken apart during a previous close pass to Jupiter in 1992, when it strayed inside the Roche Limit.

21 fragments of Shoemaker-Levy 9, imaged by Hubble two months before its collision with Jupiter. (Source)

This really exemplifies one of my favorite things about astronomy. A physical process might be totally mundane and unexciting on Earth. But once you look out at the rest of the Universe, and encounter totally different scales than what humans are used to, odds are you can see it doing something absolutely insane.

Tuesday, March 4, 2014

Artistic Skills Put to the Test: Tides Near and Far

Recall the reading assignment about tides. Draw a circle representing the Earth (mass $M_E$) with 8 equally spaced point masses, $m$, placed around the circumference. Also draw the Moon with mass $M_m$ to the side of the Earth. In the following, do each item pictorally, with vectors showing the relative strengths of various forces at each point. Don't worry about the exact geometry, trig and algebra. I just want you to think about and draw force vectors qualitatively, at least initially.

a) What is the gravitational force due to the Moon, $\vec{F}_{m, cen}$, on a point at the center of the Earth?

This is a pretty straightforward application of Newton's law of universal gravitation, $\frac{GMm}{r^2}$. However, we're not worrying about the math of this (at least not right yet), so we can pretty intuitively draw a vector from the center of the Earth in the direction of the Moon--this is the effect that the Moon's gravity is having on the Earth as a whole.

Not to scale.

b) What is the force vector on each point mass, $\vec{F}_m$, due to the Moon? Draw these vectors at each point.

Again, we aren't too worried about the exact magnitude and direction of each force vector. We could calculate them if we felt a burning desire to--the only tricky part lies in figuring out the exact distances and directions from each point mass to the center of the Moon, which at worst is a slightly ugly geometry problem. But those details aren't really that important here. What we're concerned with is the relative strength of each force vector, which is just a function of distance. As intuition would suggest, the closer point masses are going to feel a stronger tug from the Moon, while the more distant ones on the far side of the planet are going to feel less.

Still not to scale.

It's worth noting that, while it seems like the top and bottom point masses should have a fairly extreme angle, that's due to the difficulty in scaling a drawing like this. As you'll no doubt recall, the Moon is far enough a way that the force vectors are almost (though not quite) parallel.


c) What is the force difference, $\Delta\vec{F}_m$, between each point and Earth's center? This is the tidal force.

What we're looking at here is how hard each of our point masses is being pulled relative to the Earth as a whole. As we just showed, the point masses closer to the Moon are getting pulled harder (since the force vectors have a greater magnitude), and those farther away are feeling a weaker attraction.


It's a bit unclear on that drawing, since it's hard to tell what's the Moon's gravitational force (the original $F$ vectors) and what's the tidal force. But if you take out the extraneous stuff, you're left with something that looks like this:


The result is that, when we do some basic vector subtraction, the point masses closer to the Moon are getting pulled with magnitude $\Delta\vec{F}_m$ toward the Moon, while those farther away are (somewhat counterintuitively) getting pulled with magnitude $\Delta\vec{F}_m$ away from the Moon. This seems bizarre at first, but remember that we're looking at the difference in force between each point and the center of the Earth. Since the far side of the Earth is getting pulled less strongly than the planet as a whole, it's actually "stretching" out away from the planet's center. One way to imagine this is by thinking about the Earth as being like a rubber band held at each end. Pulling on one side of the rubber band stretches both ends out away from the center, even if the other hand is holding still.*

Meanwhile, 90 degrees away from the Moon, the force vectors are actually pointing inward. Since the magnitude of the force vectors on these two point masses is pretty close to being the same as that affecting the center of the Earth, $\Delta\vec{F}_m$ is very weak at each one. However, that tiny vertical component of each $\vec{F}_m$ remains, along with an even tinier horizontal component. Because these two points are the slightest bit farther away from the Moon than the center of the Earth, this horizontal component actually points away from the Moon. You can use the rubber band analogy for this part as well--at least for the vertical component of $vec{F}_m$--imagine how, as you stretch out a rubber band, it gets narrower as well as longer. While different processes are at work here, it definitely helps as a way of visualizing what's happening.


d) What will this do to the ocean located at each point?

No tricks here--since the ocean is (surprise!) fluid, it will flow in the direction of the force vectors. As a result, you get high tides on the side of the Earth directly in line with the Moon (on both sides of the planet!), and low tides 90 degrees away.


e) How many tides are experienced each day at a given location located along the Moon's orbital plane?

Again, this follows intuition. Since the Moon orbits us slowly enough that it doesn't affect the number of times the configuration we drew will occur each day, each Earthly point in the Moon's orbital plane will experience two high tides for every rotation of the Earth--one when the Moon is directly overhead, and one when it is at the nadir.


f) Okay, now we will use some math. For the two points located at the nearest and farthest points from the Moon, which are separated by a distance $\Delta r$ compared to the Earth-Moon distance $r$, show that the force difference is given by \[\Delta\vec{F}_m = \frac{2GmM_m}{r^3}\Delta r\]
Alas, our happy time of rough pictoral and geometric approximations has come to an end. Fortunately, though, the worst thing we'll be up against here is a not-terribly-bad derivative. If we define a function $f(r)$ as the universal law of gravitation, this actually works out quite nicely. The force felt by each point mass can be defined as $f(r_0)$ and $f(r_0+2R_E)$. Or, defined slightly differently, $f(r_0)$ and $f(r_0+\Delta r)$, where in this case $\Delta r = 2R_E$. The question also provides a helpful hint in reminding us that \[\lim_{x \to 0}\frac{f(x+\Delta x) - f(x)}{\Delta x} = \frac{d}{dx}f(x) \approx \frac{\Delta f(x)}{\Delta x}\] We have an $f(x)$ and an $f(x+\Delta x)$. Thus, if we take the derivative of $f(r)$, it should point us in the right direction. As with most constant-filled equations, $\frac{df}{dr}$ looks worse than it is, and a simple application of the power rule tells us that \[\frac{df}{dr} = \frac{-2GmM_m}{r^3} \approx \frac{\Delta f(r)}{\Delta r}\] We can ignore the negative sign since what we have here is a comparison--it'll be positive or negative depending on whether we're going from the closer point to the farther one or vise-versa--and if we multiply the $\Delta r$ up to the other side (and remember that $\Delta f(r) = \Delta \vec{F}$), we see that, as we expected \[\Delta \vec{F} = \frac{2GmM_m}{r^3}\Delta r \]


g) Compare the magnitude of the tidal force $\Delta \vec{F}_m$ caused by the Moon to $\Delta \vec{F}_s $ caused by the Sun. Which is stronger and by how much? What happens when the Moon and the Sun are on the same side of the Earth?

For this one, we're really just taking our solution to f), plugging in two sets of numbers, and dividing them. The nice part is that a lot cancels--${2Gm}$ is constant in both, and we're left with $\Delta \vec{F}=\frac{M_s \times r^3}{M_m \times a^3}$ where $a$ is the distance from the Earth to the Sun, 1 AU. It comes out to $0.425$, telling us that the Moon, despite being vastly smaller than the Sun, has almost two and a half times as much tidal affect on the Earth. When the two line up, however, you get a spring tide, where their cumulative affect leads to the highest possible tide. Meanwhile, when the two are 90 degrees apart , the two tides are acting against each other, leading to a neap tide. Thus, there are two configurations that lead to a spring tide--when the moon is directly between the Earth and the Sun, and when the Earth is directly between the Moon and Sun--and two configurations that lead to a neap tide--at the first and last quarter (confusingly, when the Moon is half full either waxing or waning).

This image actually only shows one of the two neap tides, but you can imagine the other--just put the Moon below the Earth instead of above it (Source)


h) How does the magnitude of $\Delta \vec{F}_m$ caused by the Moon compare to the tidal force caused by Jupiter during its closest approach to the Earth ($r \approx $ 4 AU$)?

Mighty Jupiter is going to look a bit weak here, thanks to the fact that $\Delta\vec{F}$ is decreasing as an inverse cube of the distance between the two objects. We'll set up the same way we did in part g), giving us $\Delta \vec{F}=\frac{M_j \times r^3}{M_m \times d_j^3}$. When we once again plug in the quantities, we get a rather disappointing result of $6.68 /times 10^{-6}$--even at its closest approach, Jupiter's effect is six orders of magnitude weaker than the Moon's. Along the Bay of Fundy, which experiences the highest tidal variation in the world, this would mean Jupiter was raising the water level a staggering 0.11 millimeters--about the width of a human hair.

The Bay of Fundy. Jupiter probably isn't making much difference here (Source)

As usual, I'm reserving the end for a shoutout to my collaborators--this time, Anne Madoff and Scott Zhuge.

*I'm not sure who originally came up with this analogy--it wasn't me, though I'm not sure where I first heard it.