BACKGROUND
The third component necessary for us to measure the astronomical unit is the rotational velocity of the Sun. Like essentially all celestial objects, from dwarf planets to galaxies, the Sun rotates on its axis. The Sun was born when a cloud of gas collapsed into a protostar and protoplanetary disc, all of which spun in concert. Then, gradually, the protostar ignited into the ball of nuclear fusion we know and love, and the protoplanetary disc came together to form planets, moons, and asteroids.
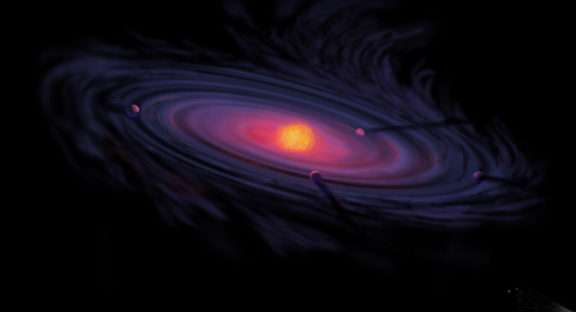
An artist's conception of a protoplanetary disc like the one that evolved into our solar system (source).
Despite no longer being a uniform cloud of gas, the solar system's objects have preserved the angular momentum of the primordial solar system, which is why nearly all of the objects in the solar system orbit the sun and rotate on their axes counterclockwise when viewed from the North Celestial Pole (with some notable--and cool--exceptions). Billions of years later, the orbits of the planets are dictated by some by-now very familiar laws, but the momentum driving the planets around their axes--and around the Sun--is the same as that of our solar system's earliest days.
EQUIPMENT AND OBSERVATIONS
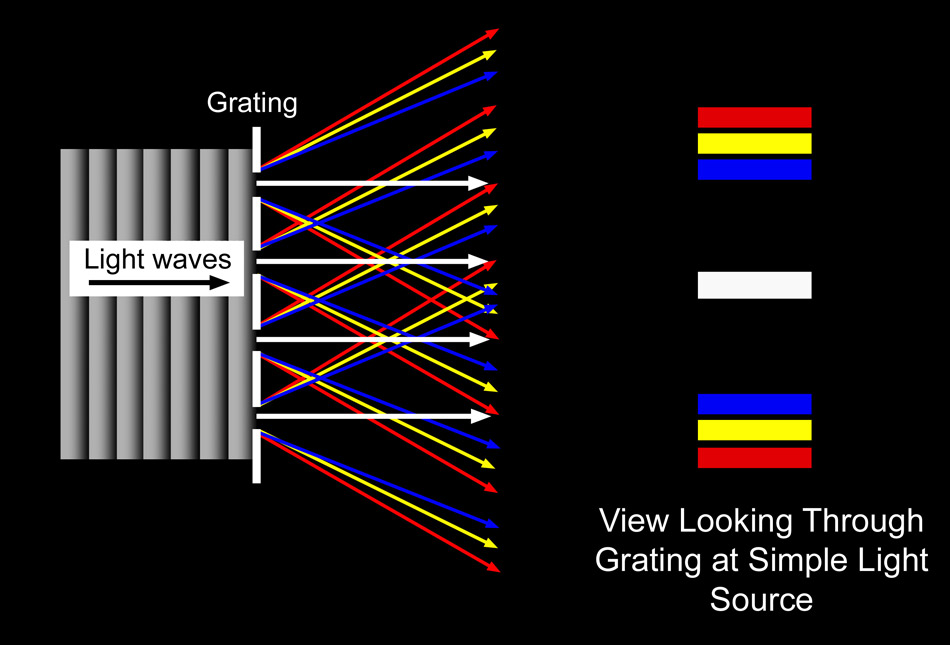
Basic scheme of a diffraction grating (source). A great tool for investigating how diffraction gratings work is also located here.
Once sunlight is directed into the slit, it becomes possible to place an eyepiece onto the front of the spectrograph and visually examine the spectrum of the Sun. My stalwart colleague Anne Madoff produced a beautiful image of the result, shown below.
You should all check out the outstanding blog located at the source.
Doppler shift (source).
Redshift and blueshift (source).
Thus, in order to determine the rotational velocity of the Sun we could take spectra at the eastern and western limb of the Sun's equator (since it is rotating the fastest at its equator) and measure the offset between the wavelength of a given spectral line in each measurement--in our case, we used the NaD (sodium) lines with wavelengths 5889 and 5896 angstroms. Thus, our first step was not directly observing the spectrum of the Sun, but rather setting up a CCD camera and recording images of the spectrum of a sodium lamp in order to focus the camera on the region of the spectrum where the NaD lines fall. This is a delicate process involving more than simply aiming the camera at the right spot on the spectrograph's screen. Once the CCD was in essentially the right place, we then had to move it carefully toward and away from the spectrograph in the tiniest increments possible, recording an image after every movement in order to achieve the sharpest possible focus. This process involved dozens of tiny movements and test images, and only when it was complete could we remove the sodium lamp and aim sunlight into the spectrograph.
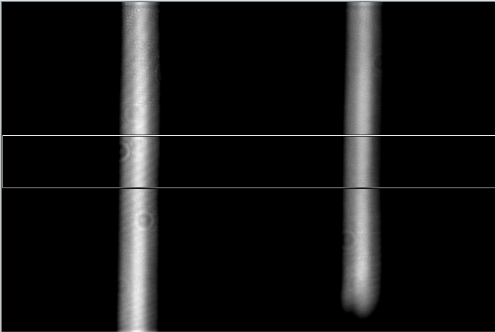
The Sodium NaD lines, as seen while focusing the CCD. We took an enormous number of images like this one, making minute adjustments to the position of the CCD after each one in order to achieve the sharpest possible focus on the two lines.
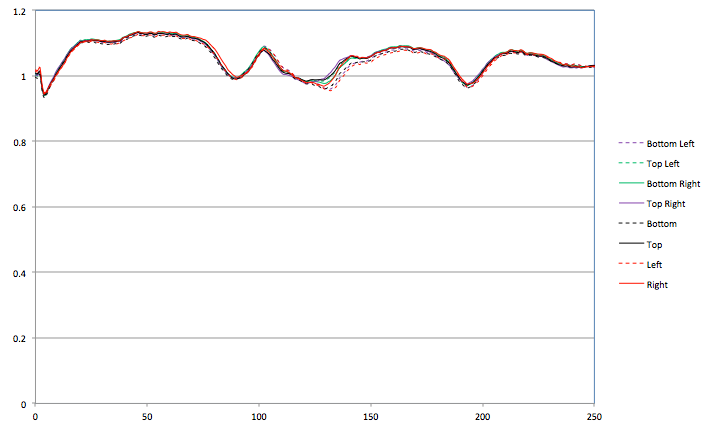
However, since the orientation of the Sun in our sky varies as a result to the Earth's axial tilt (and, on top of that, the heliostat inverts the image of the Sun), it is not immediately apparent where the Sun's equator is. In order to determine this, we took pairs of images (in order to give us a sample size of two, rather than one) at eight different locations on the edge of the Sun--the top and bottom, left and right, upper left and lower right, and lower left and upper right. MaximDL, our image processing software, then exported the spectral data (flux at each wavelength) to a Microsoft Excel file, where we were able to create a normalized plot overlaying all of our sets of observations in order to see which two points had the greatest offset--in our case, this was the upper right and bottom left. The line connecting these two points was assumed to be the equator of the Sun, and the two points themselves the western- and easternmost limbs of the Sun.
One of the two normalized plots of our observations. Note the variation between data series in the middle spectral line (to the left is an unshifted atmospheric water line).
The last step was to apply a final calibration based on examination of a telluric (literally, "of the Earth") water line--a spectral line produced by sunlight being absorbed by atmospheric water. Since this line was produced by our own atmosphere, it was unshifted. However, there was still a discrepancy between the telluric line as it appeared in the spectrum from the upper left and from the lower right. This discrepancy was measured in the same way as the $\Delta \lambda$ of the NaD lines, and the resultant figure applied as a conversion factor to our measured velocity.
RESULTS AND CONCLUSIONS
Since we observed two separate lines in two different sets of observations (since all images were taken in pairs), we essentially had four sets of data to work with. Integrating all of our observed doppler shifts and applying the calculations detailed above gave us the data shown below.
While $n=4$ is still a fairly low sample size, the $\Delta \lambda$ for each of the two NaD lines agreed very closely with one another within each set of images, as did the resultant rotational velocities between the two sets of observations--which average to 0.9597 km/s. Strictly speaking, rotational velocity should be measured in degrees or radians per second; however our measurements were of the linear velocity toward or away from the Earth, and a rotational velocity in km/s will prove vital in future calculation of the physical size of the Sun.
Despite the consistency of our measurements, however, they do not agree closely with literature values of the rotational velocity of the Sun at the equator--approximately 2 km/s. Our observations yielded almost exactly half of that value. As usual, several sources of error could have contributed to this, and as usual, simple human error is foremost among them. While the mathematical basis of our calculations was sound, there were opportunities for flawed measurements, perhaps most notably when lining up the four different axes across which the rotational velocity could be measured. It was difficult to get exactly the right point on the Sun's disc on the slit for each measurement, and it is likely that some, if not all, of the pairs were not directly across from one another. Even if they were, it is possible that the Sun's equator might lie between two of the measured axes. Both of these circumstances would lead to a lower measured rotational velocity than the reality. Finally, our sample size of two was unquestionably inadequate, and indeed only comprised two separate sample sizes in some specific senses. Were our experiment to be repeated, it would be vital to do multiple iterations of it start to finish, particularly the process of lining the disc of the Sun up onto the slit of the spectrograph (which was only done once in our case, with images taken in pairs). Repeating this phase of the experiment would likely eliminate much of the considerable error discussed above. Aside from the limitations imposed by a small number of trials, however, our overall methodology was quite sound--particularly concerning the reduction of data once taken--and could be usefully employed in future experiments of a similar nature.


Great work Tom! You do a great job of discussing every step in a clear yet concise way.
ReplyDeleteAlso very cool that you linked to Anne's beautiful image!
ReplyDelete